Does Notation Matter (Part 2)
This is the continuation of the mini-series of blogs about different notations used to capture requirements. In the first part we have looked at notations for decomposing a system in the large and compared natural language with use case diagrams and story maps.
In this paper we want to dive deeper and see how we could specify the details of one selected process. Again the choice is between writing and modeling. Here is an excerpt of our swimming league case study AQUARIUS about the enrolment of children into a competition. The overall use case whould be:
As a child I want to enrol into a competition.
Let us start with two different kinds of textual specifications (always concentrating on the sunshine scenario and ignoring error cases):
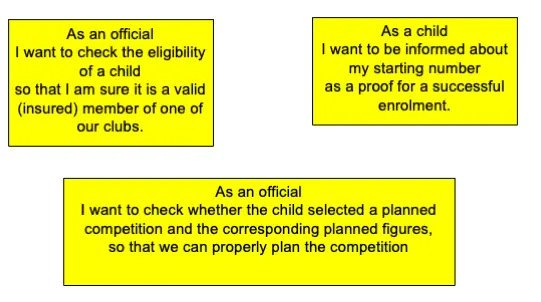
(R1) In the process of enrolment AQUARIUS should check, that the child is an eligible member of one of our clubs.
(R2) AQUARIUS shall also check whether the selected competition is valid and the selected figure are really planned for that competition.
(R3) If everything is ok, AQUARIUS shall inform the child about the next free starting number and put the child on the starter list.
For those of you, who like to phrase all requirements as stories, let me rewrite the three statements as story cards (as refinement of the big story above):
If you are a child of the 80s you have probably learned to specify these process steps in form of a dataflow diagram, showing the key functions and their inputs and outputs, as well as stored data. Here is a way of specifying the above mentioned process:
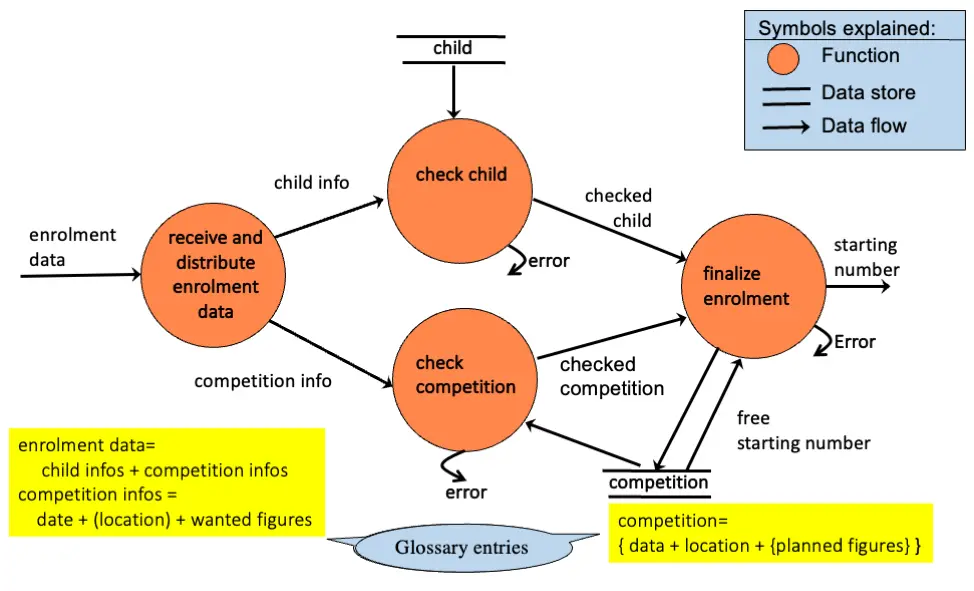
For those of you not familiar with the notation I have included a short legend. And it was good style to specify domain terms like “competition” or “enrolment data” in a glossary (shown in yellow in the picture above). More about glossaries in part III of this mini-series.
If you were born a little bit later and got your education in the 90s, when UML was the dominant notation, you would probably draw the process as an activity diagram as shown below.
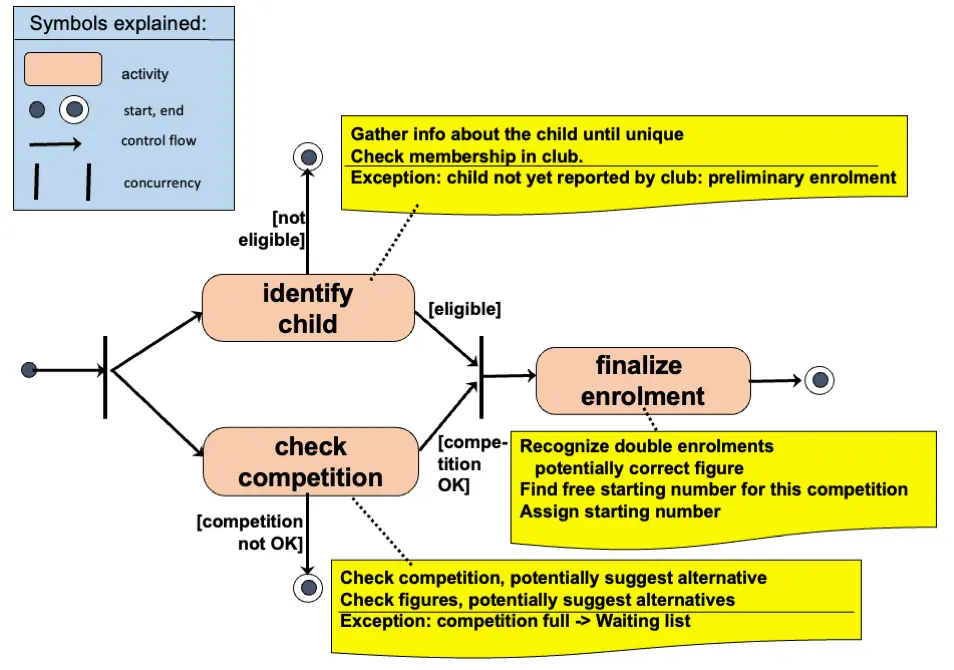
Again, I included a short legend in case you are not aware of the syntax of such diagrams. And I sketched the activity descriptions in yellow. They would normally be hidden “behind” the activity symbol, if you are using a good tool allowing you to double-click on the activity symbol.
I could have included yet another form of diagrams (e.g. activity diagrams with object flow as a compromise between dataflow diagrams and activity diagrams) or a BPMN diagram or even a good old flow-chart. But that is not important for our question “Does notation matter?”
So, does notation matter?
Maybe you immediately like one or the other notation of the example above. Are you more comfortable with one or the other textual representation of the requirements? Or do you like one of the pictures showing the same requirements? Or would you have preferred a user interface sketch of the enrolment screen?
Independent of your preference – my answer is: Yes, notation does matter.
As mentioned in part I, according to the Sapir–Whorf hypothesis language (or notation) does influence the way you are thinking about the problem at hand.
Both textual descriptions have the advantage that you don’t have to learn anything (other than your mother-tongue). Everyone can easily read them. The story-version is a little bit more precise since it does not only mention the function, but also the motivation (with the so-that part at the end). But both of them do not show dependencies between the steps – if you don’t consider the requirements ids (R1), (R2), (R3) as a sequence.
Both kinds of diagrams DO show dependencies between the individual functions: the dataflow diagram show input-output relationships between the functions, while the activity diagram concentrates on flow-of-control relationships. In both cases you discover that the two functions (checking the child and checking the competition) are independent of each other. You can start with either function. There is no prescribed sequence.
Note, that the numbering in the first textual description is even misleading: (R2) does not have to happen after (R1). Such an “overspecification” is a trap that users of activity diagrams, also often fall into by modeling a sequence of linear steps and overlooking the potential concurrency.
Seeing this mistake (this enforced sequencing) is much easier, if you think in dataflows. You will easily recognize that the two parts of the input “enrolment data”, i.e. the child data and the competition data, can be handled independently of each other.
Our Advice
In req42 we start with the assumption that there is a strong trend at the moment to specify requirements as epics, features and stories, i.e. in textual notation. This is mainly influenced by tools like Confluence and JIRA, that are text-based. We advise you to look beyond the management of the product backlog. For that we have introduced “Supporting Models” as an additional artifact in the “Universe of the Product Owner”. The idea is to use graphical models like activity diagrams, state charts, dataflow diagram or UI mockups to support your refinement process of coarse level requirements (and – of course – to maybe have a more adequate tool for communication beyond stacks of story cards.)
Do not ignore the power or such supporting models but do also not strive for perfection – like we often did in the 80s and 90s. Such models are very useful tools. Pick the ones that assist your own thinking process and make communication with other stakeholders easier.
Remember: Agile Requirements Engineering is more than just maintaining your product backlog.