Requirements Modeling - Then and Now
A little bit of history
If you look back in the history of requirements engineering you will notice that in the 70s we mainly used natural language to express requirements. Informal sentences like “The system shall …” or “The system should …” were dominant.
At that time some people started complaining about the shortcomings of natural language to express precise requirements. Graphical notations were suggested to overcome the problems of natural language.
- Flowcharts helped us to express sequences, alternative and loops in functionality
- Peter Chen suggested Entity-Relationship-Diagrams to identify the “things” we want to implement in our systems and their relationships
- Tom DeMarco and others suggested data flow diagrams
- In the mid 80s state-models were added to formally represent states of systems and transitions triggered by events
- In the early 90s Ivar Jacobson’s use cases found many fans around the world to portray an overview of planned systems
- In Germany EPKs (event process chains, developed by Prof. Scheer in 1992) reached local popularity
The modeling hype culminated in the mid 90s with the standardization of UML (the Unified Modeling Language). A set of 12 different diagrams have been standardized by the OMG (Object Management Group), many of them supporting more formal requirements specifications like use case diagrams, (entity-)class diagrams, activity diagrams, and sequence diagrams.
More than a dozen of tools and even more books on that subject flooded the market.
But – alas – despite their advantages over natural languages in terms of precision and non-interpretability of requirements – these graphical methods never really took off in IT projects. The main reason: everybody can read and write natural language, but not everybody mastered the complexity of these diagrams.
At the turn of the century agile methods became more and more popular – and with them the return to natural language requirements. We learned to write epics, features and user stories. Finally, natural language is mainstream again, although sentence templates like “As a
In parallel to the growth of agile requirements engineering more graphical notations like BMPN (invented by IBM in 2001 and standardized by the OMG in 2005) and SysML (also jointly created in 2001 by OMG and INCOSE and standardized in 2006) came into the market. Both – in my opinion – never got into the mainstream.
The following picture summarizes my personal estimate about the use of textual or graphical notations over the last five decades.
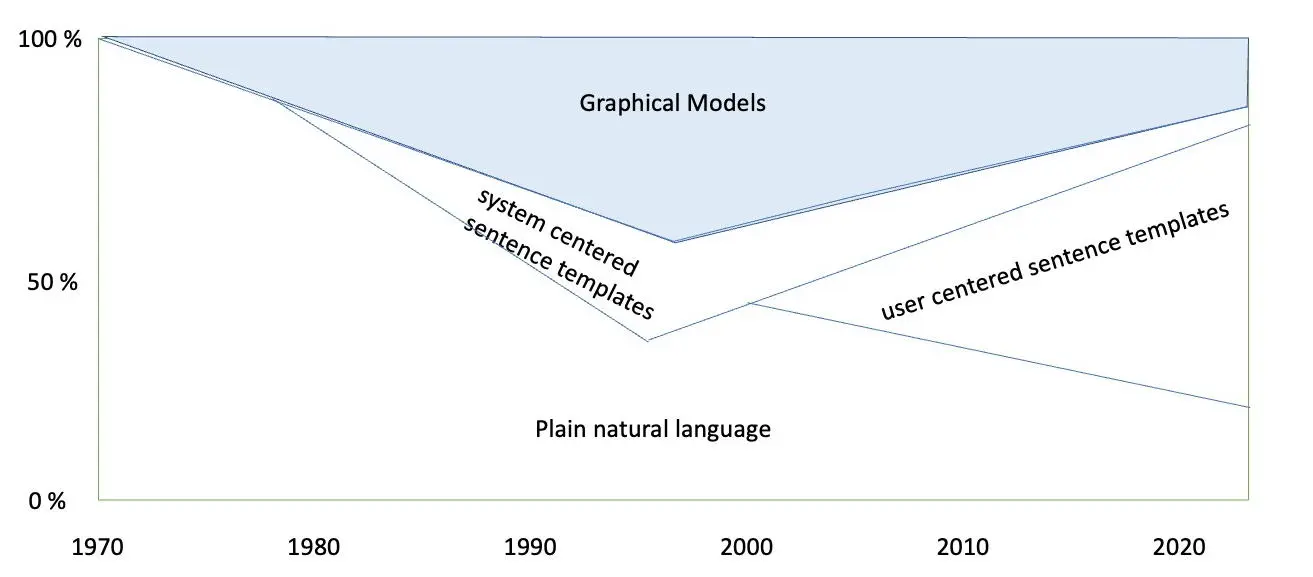
You see that
- modeling was never dominant; its strongest time were the last two decades of the 20th century – and it was less than 1/3 of requirements people using it.
- lots of specifications have been – and still are – written in plain text without any kind of restrictions (or precise meanings)
- only few people used system centered template (like “under this condition the system shall do this”), and
- with the advent of agile methods the “user story template” really took off.
The Trend
I have to confess that I am an avid fan of modeling – for requirements and for system architecture. I love to think and communicate in pictures, much more that just talking or writing extensive texts. But, as the picture above shows, I am part of a minority.
In the 80 and 90s – if you used models – they were supposed to be precise, consistent and complete. Already with the advent of UML I saw a shift from precise to “useful”. In other words: any graphical representation that helps to communicate with stakeholders is a good graphic. There is no need to be very exact and consistent.
The advent of agile methods that advocate “more talking and less writing or drawing” anyhow, has also changed requirements engineering.
This is most clearly expressed by the CCC-rule (card – communication – confirmation): A card with a user story is not meant to be a complete, exact requirement, but just a placeholder to remember the conversation that you had with your team about that subject.
The same is true for graphical models: A model is just there to discuss an issue with others – and no longer to be a precise requirement.
However, you should not be sloppy or misleading on purpose: If you draw an activity diagram, the sequence of steps should match reality. And if you sketch a domain-entity-model, the names should conform to the business terms and the lines should represent relationships of the real world that you want to be implemented in your product.
This trend towards more “usefulness” instead of precision has triggered us to call these models “supporting models” in req42´s “universe of the product owner”. They are considered to support user-centric natural language statements, not to replace them.
The following sections summarize some suggestions of req42 on how to use models today.
Recommendations for Models:
Context Diagram:
For me this one is an absolute must. If you only draw one picture for your specification, make it a context diagram!
It clarifies:
- the name of the product/system (sounds trivial, but is not trivial)
- ALL the neighbors (humans, other systems, sensors & actuators), and
- most important: the interfaces between your system and the environment (suggestion: use data-flows in and out of your system)
Use Case Models:
For a top-level decomposition I still like Ivar Jacobsons use case diagram. It shows the actors (humans or other systems) and the system processes in one overview picture.
I recommend that you don’t bother about “include” and “extends” (and also “generalization). Such partial processes are much easier shown as activity diagram or dataflow diagram. Not showing them keeps the use case model clean and simple.
So, you better stick to actors and use cases, only.
Bounded Context Diagrams:
If you don’t decompose your system into processes, but into bounded contexts, then an overview diagram of your bounded contexts (and simple lines or arrows to show the dependencies between them) is useful. Such a diagram also gives you a top-level decomposition for your requirements.
As mentioned above, I am a very visually oriented person and like overview diagrams like use case diagrams or bounded context diagrams. But I have to confess, that a properly written list of epics is as good as the diagrams for a top-level decomposition.
Information models:
A key model, even in agile requirements, is a model of your domain terminology – which is also suggested by DDD (Domain Driven Design).
It often helps to sketch an ER-model (or a UML class diagram), showing the most important terms in your domain as boxes and the most important relationships as lines.
However, you don’t need to add all attributes to the business entities, and maybe you can get away without exact multiplicities and be a bit sloppy on naming trivial relationships.
I would also recommend being careful with the use of the inheritance symbol of the UML the triangle) and with aggregation and composition symbols (the white and black diamonds). Often an informal name on the relationship (consists of, inherits from) is good enough instead of syntactic symbols that not everyone can interpret.
Normally, a diagram with 10 – 20 domain entities is sufficient to establish a good terminology for the project. Don’t exaggerate in size!
The alternative to a graphical model of your key domain terms is an alphabetically sorted glossary. There you are missing the relationships, of course.
Behavior models
If you need a closer look at the functional requirements any kind of flow chart, activity diagram, data flow diagram, BPMN diagram, …can be useful.
Again, I would advise to stick to the most simple syntactic elements (e.g. alternatives and concurrency – if you use activity diagrams).
Of course, nesting such diagrams hierarchically helps to control complexity. Very rarely will you need more than two levels.
For some kinds of systems that are state dependent, a state-model is very useful to show the key states and events triggering the transitions between them.
Don’t bother to model a state diagram with only two states (like “light on or off”).
Advanced concepts like nested states and history, the precise distinction between actions and activities are maybe already too complex for many readers. Be careful when you use them.
I would rather advocate that you make sure that functions triggered on a transition to use the same names like your flow models
Example behavior:
Diagrams to express example behavior (like e.g. sequence diagrams) are not so wide-spread in requirements analysis as they are in system architecture. In requirements they can be useful to show exemplary course of actions between the environment and the overall system (as a black box), i.e. typical user interface scenarios.
I suggest to replace these complex diagrams with simple lists:
- the user enters …
- the system does …
Summary
A lot of humans still like pictures to explain complex things. Therefore, graphical models to support textual requirements are still a good idea.
As mentioned above, graphical models today are more used to communicate, to explain complex things – and not necessarily as formal requirements.
The same idea – like user stories on cards (not complete requirements, but reminders of things you discussed) – is predominant in graphical models: use the pictures to communicate, not to replace requirements.
One formal request is still valid: use a ubiquitous language (as Eric Evans calls it): The names in your pictures and the names in your epics, features and stories should be identical!
In other words: good naming is more important than detailed UML-syntax.